Hacker News
Data Validation
Context
Hacker News is a social news website focusing on computer science and entrepreneurship, run by the investment fund and startup incubator Y Combinator.
The Hacker News engineering team pushed a major backend update on October 1, 2024. The task was to validate that data capture looked normal.
The analysis was completed in April 2025.
Framework
The validation process has three stages:
Table Structure & Integrity
How is the hacker_news.full table organized? Is there a primary key to prevent duplication? Are there partitions to optimize performance?
High Level Event Count
Do we believe the volume of events (by type: story, comment, etc.) and the dates they occurred are reasonable?
Event Specific Parameters
For the priority events, are the necessary event specific parameters to provide color to the analysis coming in? Priority events: Story and Comment.
Stage 01 / Table Structure & Integrity
Takeaways
- Though there isn't a designated primary key on
hacker_news.full, there are also currently no duplicates on "ID", which the schema states is the primary unique identifier. - "Type" and "ID" are columns populated on every single row.
- "Type" is an event name that identifies the user interaction taken on the Hacker News site.
Methodology
First I examined the schema and scanned the table preview.
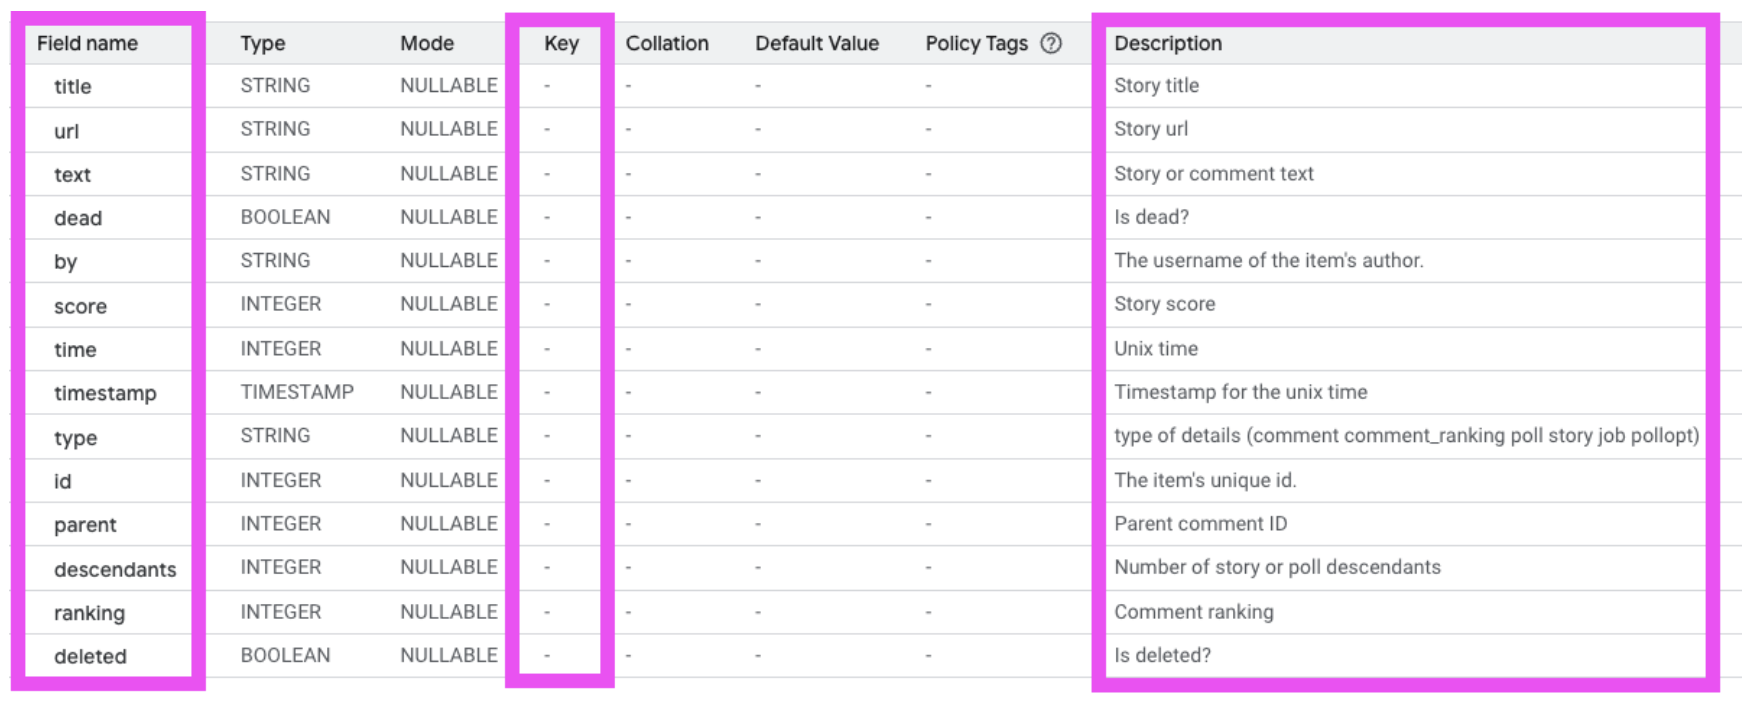
There is no designated primary key on this table, meaning there is no constraint to enforce unique rows. This is also important to note if we want to join against any other tables.
"Type" and "ID" seem to be the only columns that are always populated. "Type" looks like an event field, which describes the category of user interaction on the site. Given the context that this is a news content site, they make sense to us: comment, comment_ranking, poll, story, job, pollopt. "ID" is the identifier for an item/event. The documentation says it's unique, but it's not set as the primary key so I'd proceed with caution.
Confirmed "Type" and "ID" are populated on all rows — query returned no dataSELECT type, id
FROM `bigquery-public-data.hacker_news.full`
WHERE type IS NULL
OR id IS NULL;SELECT
id,
COUNT(*) AS id_count
FROM `bigquery-public-data.hacker_news.full`
GROUP BY 1
HAVING COUNT(*) > 1
ORDER BY 1 DESC;A query of hacker_news.information_schema.columns also tells me there is no partitioning column. I'm working with 1TB of quota and this would have been ideal to select a subset, such as a particular date range, when I don't need to scan the entire table to save on time and quota.
Stage 02 / High Level Event Count
Takeaways
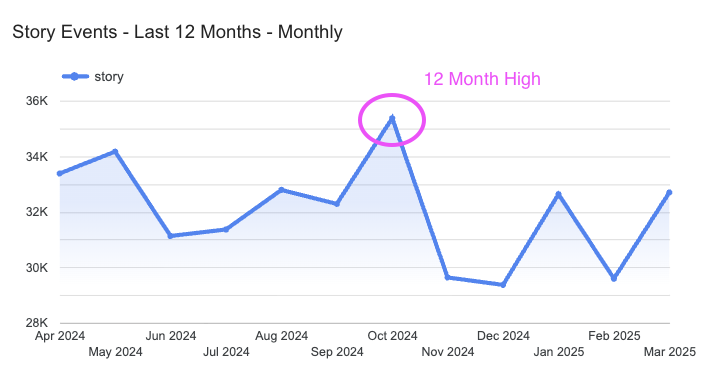
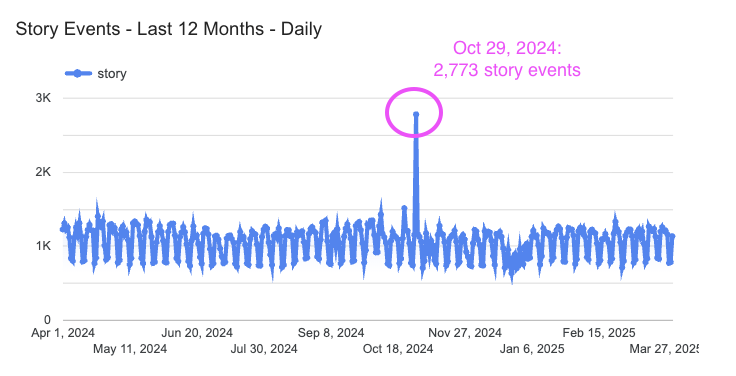
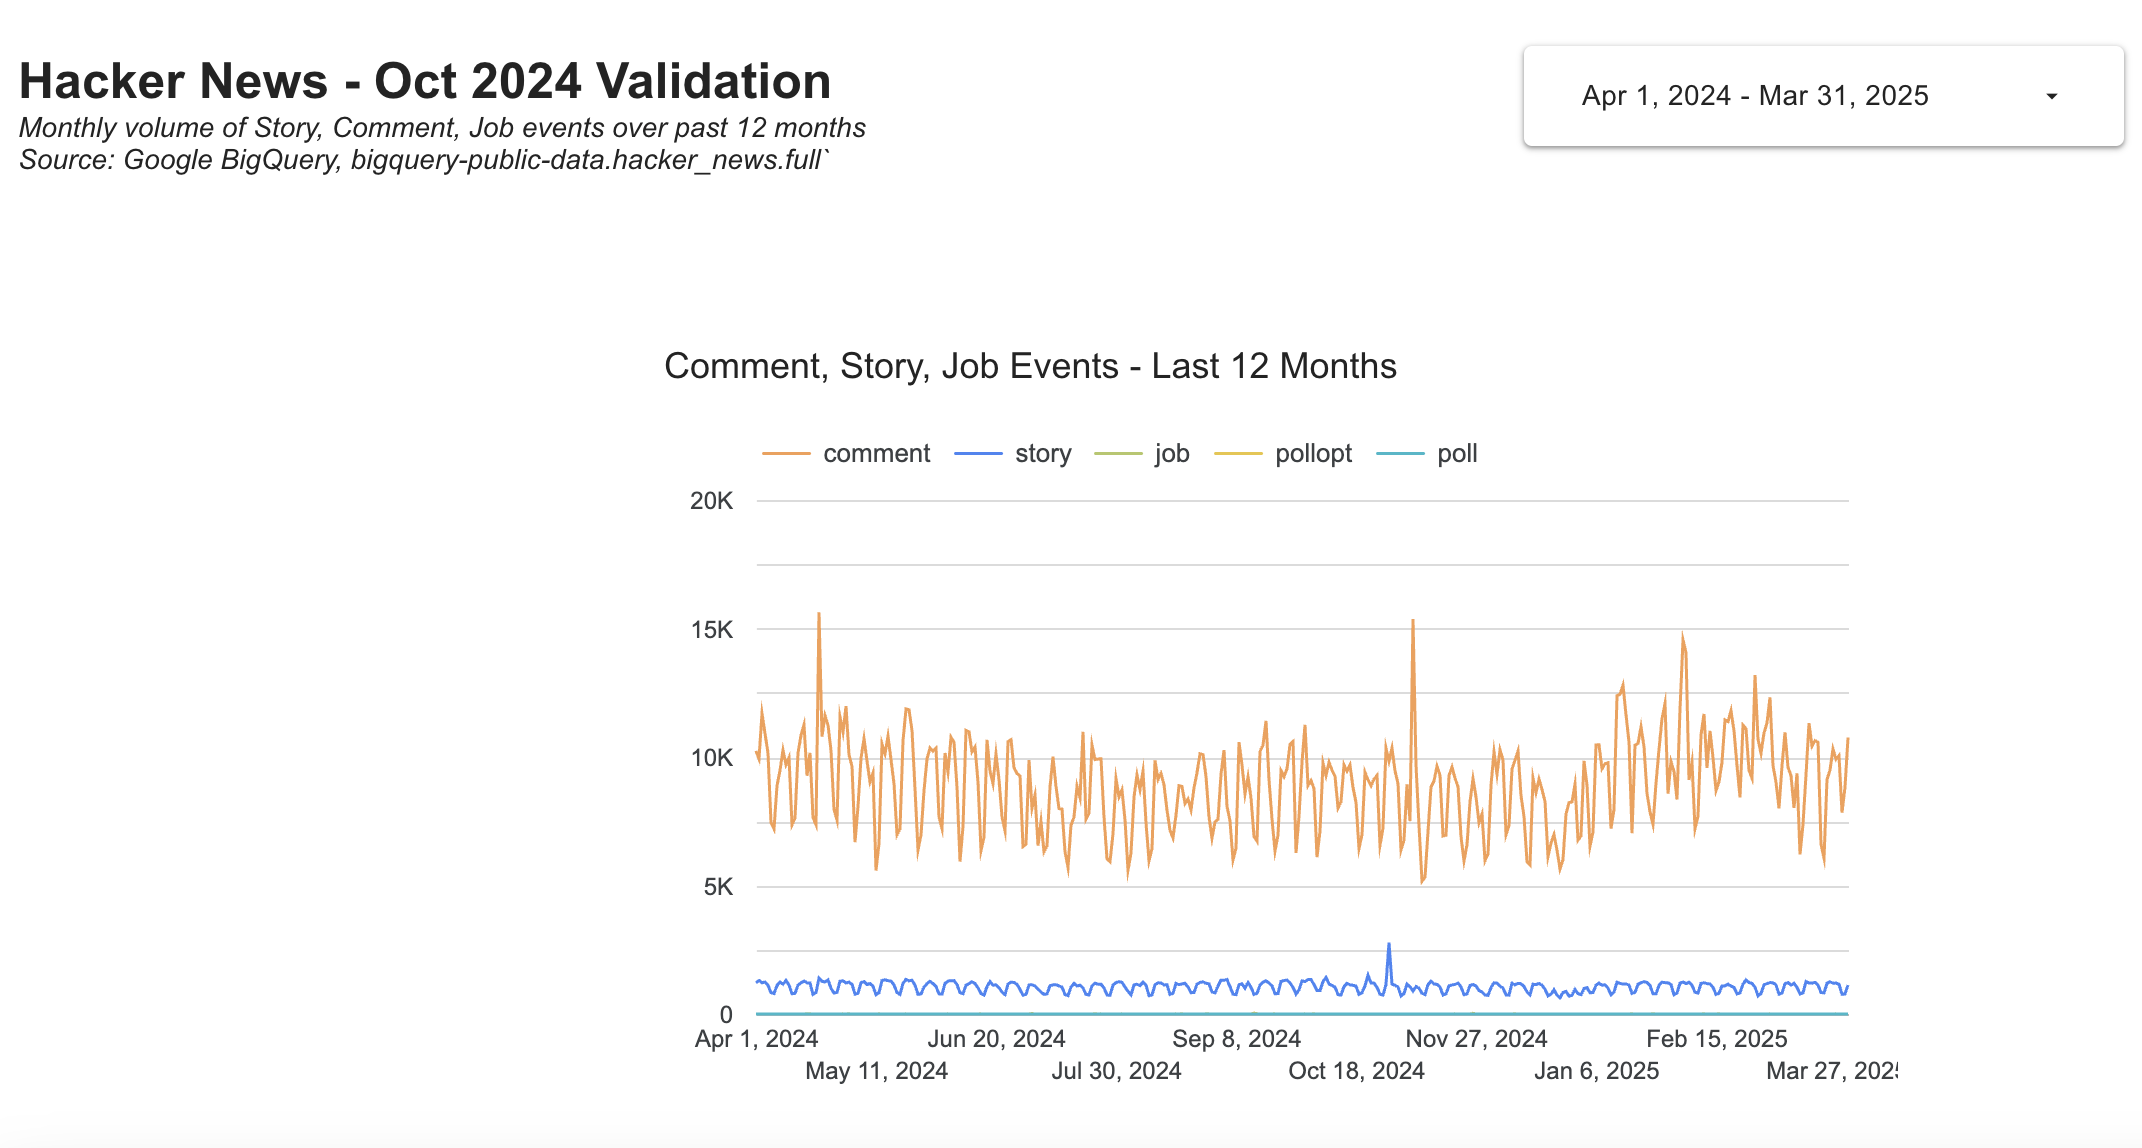
- Oct 2024 saw a 12 month high in "story" events with an acute spike on Oct 29th, so that should be treated with caution. I would verify with the marketing and product teams to see if there's any business reason for increased traffic to the site or incentive to interact more. If there was a marketing push, UTM reporting could help explain. If none of this explains the spike, it could require deeper investigation.
- Out of 43.6M rows on the table, ~27K rows are labeled as a story (0.06%), but they don't have a date attached, so we could be underreporting story events by this amount. The issue could be concentrated in one month or spread out over the table history, which goes back to 2006.
- The most common events are "comment" and "story", so these will be prioritized for parameter checks. "Job" is the 3rd most common but it is substantially lower in volume. Within the context of a news content site, "story" is the most important user event. The nature of comment interaction leads to higher volume, but it isn't a higher priority activity.
Methodology
To validate the volume of events by date, I pulled a count of events by type from the Hacker News Full Table. The timestamp field was in UTC; I assumed EST as our relevant time zone.
Event count by type and dateSELECT
FORMAT_DATE('%Y-%m-%d', DATE(timestamp, "America/New_York")) AS event_date
, type
, count(*) as events
FROM `bigquery-public-data.hacker_news.full`
GROUP BY 1,2
ORDER BY 1,2 desc;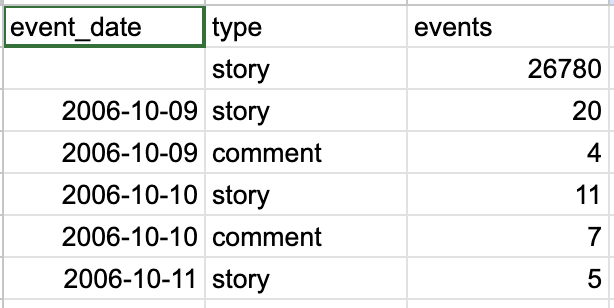
Full query results: Hacker Events by Date
Stage 03 / Event Specific Parameters
Takeaways
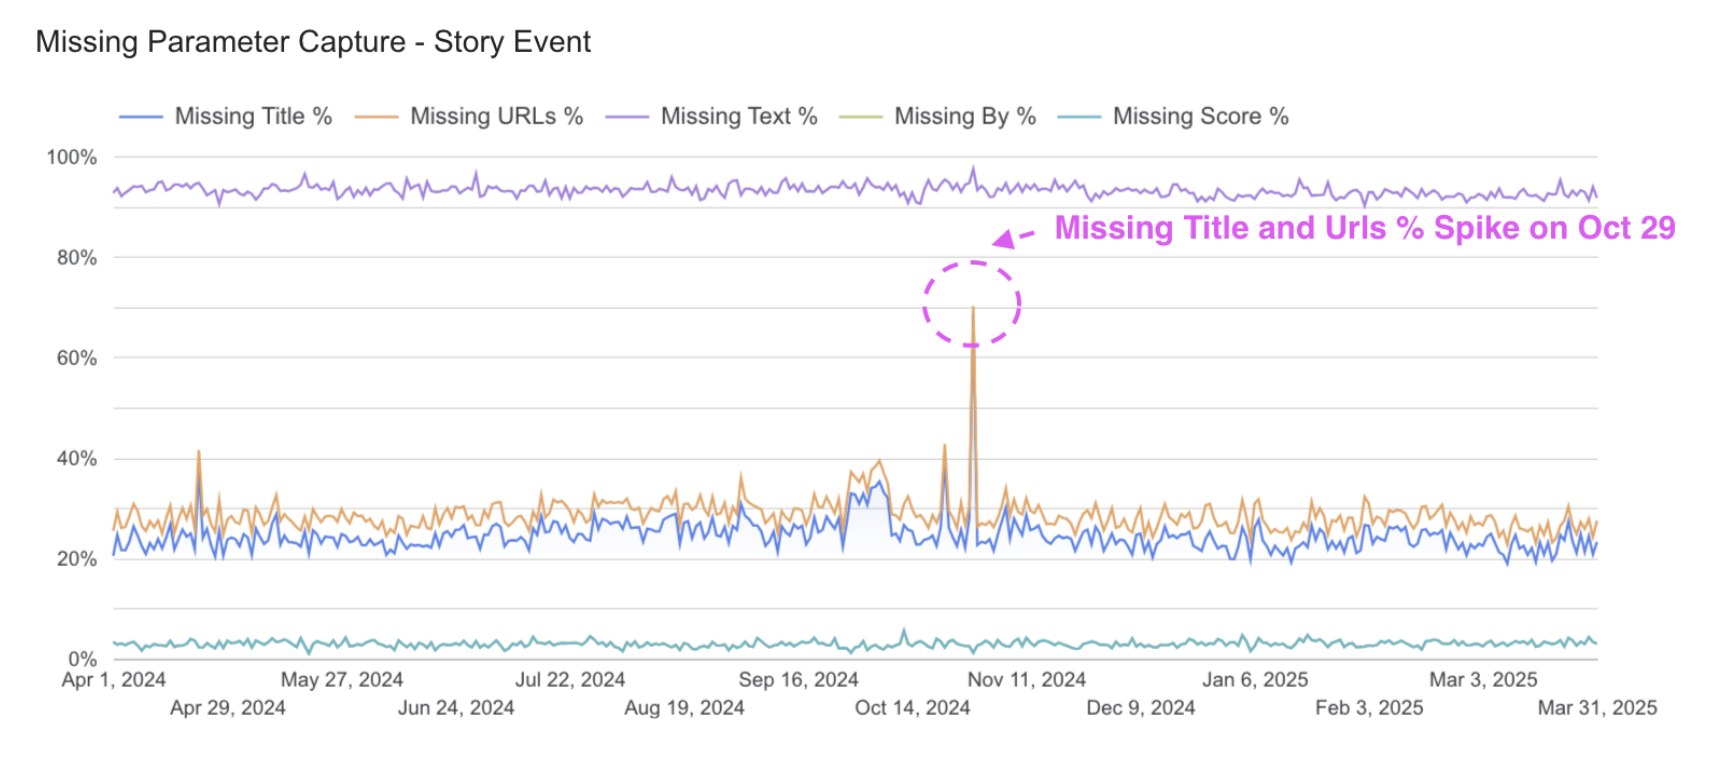
- The Oct 29 spike in story events also coincided with a spike in missing "title" and "URL". It's possible that the increased volume on the site may have impacted parameter data collection.
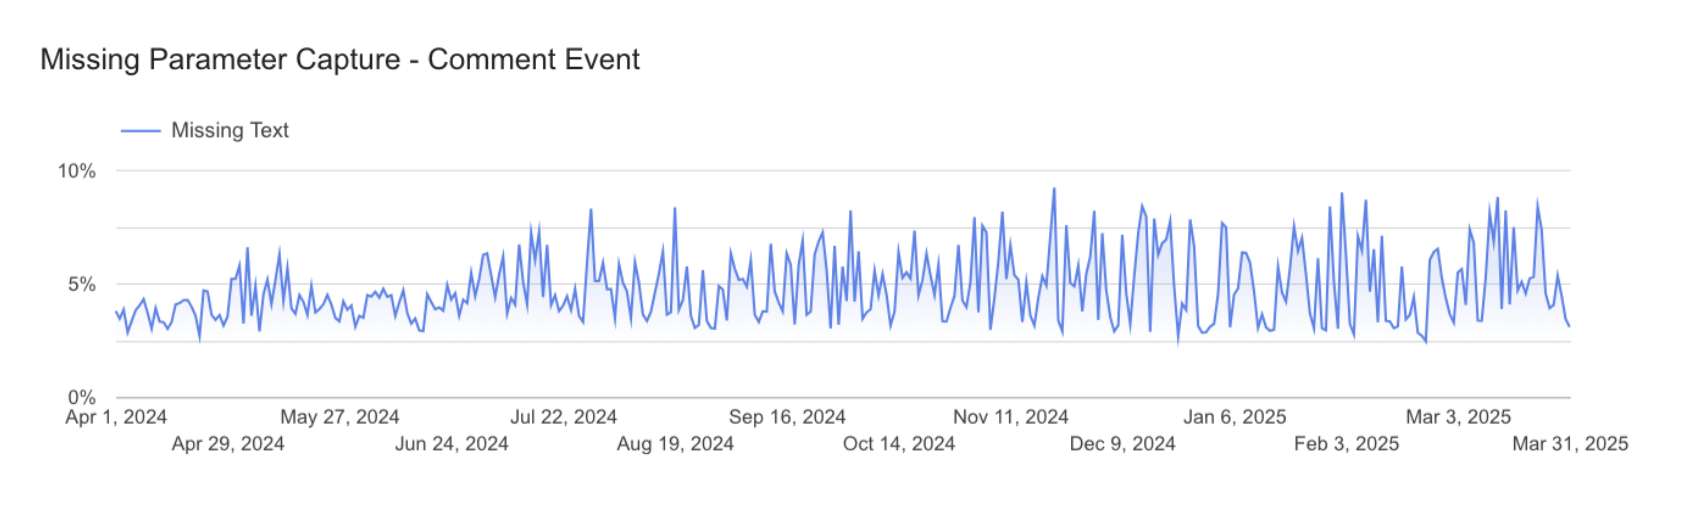
- This impact was not observed on the comment event.
Methodology
The approach was to pull the following by date for the past 12 months: story and comment events, and any cases where there are null values on their respective event parameters.
Story event parameter capture by dateSELECT
FORMAT_DATE('%Y-%m-%d', DATE(timestamp, "America/New_York")) AS event_date,
COUNT(*) AS events,
COUNTIF(title IS NULL) AS missing_title,
COUNTIF(url IS NULL) AS missing_url,
COUNTIF(text IS NULL) AS missing_text,
COUNTIF(dead IS NULL) AS missing_dead,
COUNTIF(`by` IS NULL) AS missing_by,
COUNTIF(score IS NULL) AS missing_score
FROM `bigquery-public-data.hacker_news.full`
WHERE type = 'story'
AND DATE(timestamp, "America/New_York") BETWEEN '2024-04-01' AND '2025-03-31'
GROUP BY 1
ORDER BY 1 ASC;Full query results: Story event parameter capture by date
Comment event parameter capture by dateSELECT
FORMAT_DATE('%Y-%m-%d', DATE(timestamp, "America/New_York")) AS event_date,
COUNT(*) AS events,
COUNTIF(text IS NULL) AS missing_text,
COUNTIF(parent IS NULL) AS missing_parent,
COUNTIF(descendants IS NULL) AS missing_descendants,
COUNTIF(ranking IS NULL) AS missing_ranking,
COUNTIF(deleted IS NULL) AS missing_deleted
FROM `bigquery-public-data.hacker_news.full`
WHERE type = 'comment'
AND DATE(timestamp, "America/New_York") BETWEEN '2024-04-01' AND '2025-03-31'
GROUP BY 1
ORDER BY 1 ASC;Full query results: Comment event parameter capture by date
Dashboard
The full validation dashboard is live in Looker Studio, covering missing parameter rates by date for both story and comment events across the trailing 12 months.
 View Live Dashboard
Ideal Validation
If I had more time, I would perform live QA in a pre-production environment by manually triggering key user actions (posting a story, commenting) and monitoring the Network tab to observe network calls.
I would inspect payloads to confirm that event data is correctly structured and sent to the 3rd party analytics servers (Google Analytics, Amplitude, Adobe, etc.). If server-side analytics were involved, I would validate event capture in the database by querying relevant event tables to ensure completeness and accuracy.
Ideally, I would test on every release to flag potential regression bugs.
Automation Enhancements
Moving forward, to ensure confidence in the hacker_news.full table, I would set up a series of alerts on the daily ETL process. These alerts would monitor:
- Variance in daily event volume for key event types like "story" and "comment". For example: if volume exceeds +/- 50% of the daily average, which would have flagged the Oct 29 spike.
- Variance in missing key event parameters such as "title", "url", and others critical for enriched analysis.
Alerts could be delivered via email or an automated Slack message to a monitoring channel. In addition, I would review a daily validation dashboard following each data load to proactively monitor trends.
Retrospective
- The part of the project that took the most time was exploring the table and structuring the analysis. Once I was confident in my approach, the work moved quickly. I prioritize extra time for these early steps to set up the rest of the project for success.
- Single table structure isn't ideal. Storing multiple event types in the same table leads to a large number of NULL values. I imagine this must be a drain on resources both in maintaining the database and in processing queries. I would prefer separate tables for different types of events.
- Table documentation could have been better. There was no definitive explanation of what a "story" event is: it could be anytime a story is posted or anytime it is viewed. A quick check for title duplicates showed very few so I'm inclined to believe it is new story submissions.
- BigQuery's navigation can be confusing. The interface splits across the Google Cloud Console and the BigQuery environment, which makes it easy to get lost. Query history is separated from table exploration, and it's not possible to save or manage query results directly in BigQuery. A quota limit is intimidating at first but once I was able to frame the analysis and structure my queries, the validator icon helped me understand I was well under quota. A final review in Jobs Explorer showed the overall tally was 95GB used.